 Andrew McElheran
 Jamie McGough
ISS’s introduction of EVA metrics is likely to foster discussion among compensation committees about the nature, merit and implication of these metrics. EVA may also be of interest among institutional investors as an additional lens to assess pay and performance alignment. This Client Update provides an overview of EVA, how ISS intends to use it and potential implications for compensation committees.
Background
EVA has been around for a long time but has gained little traction as a performance metric or internal financial metric. Perhaps coincidentally, ISS’s newfound interest in EVA comes on the heels of its purchase of EVA Dimensions, a consulting firm that measures and values corporate performance based on the EVA framework.
ISS is contemplating incorporating EVA into its pay-for-performance model. Currently, ISS’s pay-for-performance evaluation of Russell 3000 companies is comprised of a three-part comparative quantitative analysis. A company that receives either a “cautionary low” or a “medium” level of concern on these initial quantitative pay-for-performance tests will be subject to ISS’s Financial Performance Assessment (“FPA”). Under the FPA, ISS measures a company’s financial performance based on three or four ISS-selected GAAP-based financial metrics.
In October 2018, ISS proposed replacing GAAP-based financial metrics used in FPA with EVA metrics. However, based on investor feedback, ISS decided to leave unchanged FPA for the 2019 proxy season and to disclose EVA metrics solely for informational purposes. ISS explained this would give investors more time to “understand the EVA methodology and its potential to add additional insight to pay-for-performance evaluation.” ISS has indicated that it “will continue to explore the potential for future use of EVA” in the FPA for 2020 or later proxy seasons. We believe ISS is likely to incorporate EVA metrics into its pay-for-performance evaluation within the next two proxy seasons.
ISS’s focus on EVA will not affect how it assesses a company’s incentive arrangements. ISS is indifferent as to whether a company’s incentive arrangements use EVA-related metrics. In addition, ISS will not advise companies on the development or implementation of EVA as a performance metric.
Overview of EVA
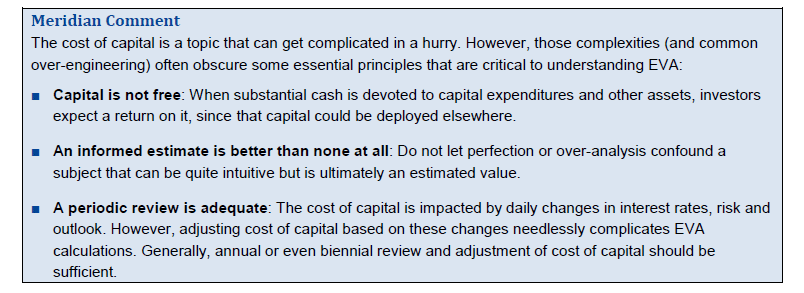
Fundamentally, EVA is a profitability metric. It is the best-known version of a class of financial performance measures known as economic profit. Distinct from accounting profit, economic profit/EVA is profitability with one additional charge—the cost of the capital employed to attain those profits. The intuition is simple: capital is not free, and companies that earn a return on that capital in excess of its opportunity cost are the only ones actually creating value.
At its simplest, EVA (or any economic profit calculation) is based on the following formula:
NOPAT – Capital × Cost of Capital = EVA
Where…
1. “NOPAT” (Net Operating Profit After-Tax) is equal to operating income less taxes on that income.
2. “Capital” is equal to total assets less non-interest bearing current liabilities (sometimes also referred to as “net assets” or “capital employed”).
3. “Cost of Capital” is equal to the minimum return on capital an investor expects over time for investing in a company of particular risk. Since capital includes both debt and equity, the cost of capital is equal to the weighted average cost of capital (“WACC”)1.

ISS Determination and Presentation of EVA Metrics for 2019 Proxy Season
Discussed below is the methodology ISS uses for calculating EVA metrics and the manner in which these metrics will be presented in its proxy reports.
Calculation of EVA Metrics
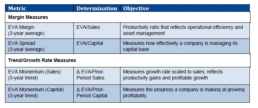
In its most basic form, EVA is a dollar-denominated measure. However, to facilitate comparison across companies, ISS will create two margin metrics and two growth (or “momentum”) metrics. The following table summarizes the EVA metrics that ISS will employ.

ISS will compute the trend measures “by running a regression line through the past four years of EVA and dividing the slope of that line by the average of the firm’s sales or capital base in the first three years.”
The two EVA margin measures should return the same directional findings: if EVA Margin is positive, EVA Spread should be as well (although potentially by a greater or lesser amount). Similarly, the “trend” measures should both be either positive or negative (not one positive and one negative).
However, the two categories of metrics will not necessarily agree, and the policy and strategy implications will be quite different depending on how those findings are interpreted. For example, a company in a low-growth industry could have strong EVA but very low or even negative growth. Alternatively, a “turnaround” company could have low or negative EVA but improvement is favorable.
Presentation of EVA Metrics in Proxy Reports
ISS will disclose the four EVA metrics in a new section of proxy reports entitled “EVA Performance” for informational purposes only. This section will be divided into two tables. One table will display for each EVA metric a numeric score and a relative performance ranking by quartile against an ISS-developed peer group. The other table will show relative quartile ranking of a company’s CEO pay and the company’s EVA performance. Below is a sample disclosure of EVA metrics developed by ISS:

For the 2019 proxy season, ISS’s vote recommendations on a company’s Say on Pay proposal or on election of incumbent directors will not be effected by the company’s EVA performance. However, we believe it is likely that within the next two proxy seasons ISS will incorporate EVA performance into its CEO pay-for-performance analysis, unless it faces strong resistance from investor clients.
Financial Services Firms: A Special Case
ISS uses a modified version of EVA for financial services firms (e.g., banks and insurance companies), which reflects the significant difference in operating models between financial and non-financial companies.
Non-financial companies provide products or services where their capital structure is not affected by the product or service. This is why among non-financial companies EVA is based on total capital deployed.
In contrast, financial services firms’ product offerings and capital structure are almost inextricably interwoven. For example, a bank is in business to make loans but those loans are substantially based on customer deposits. Therefore, the bank’s debt (deposits) and loans (assets) are central to its basic business model. Consequently, ISS uses the following modified version of EVA for financial services firms and firms whose business model is similar to financial service firms such as REITs:
■ NOPAT—Net income after financing expenses (i.e., these expenses are treated as operating costs)
■ Capital—Defined solely as common equity capital
■ Cost of Capital—Cost of equity capital only (not WACC)
In the case of REITs, an estimate of investors’ taxes will be deducted from NOPAT because REITs generally are not subject to federal income tax.
Implications for Compensation Committees
Given that ISS will be disclosing EVA metrics in this year’s proxy reports (and may adopt the metrics as part of its pay-for-performance analysis), compensation committees should possess at least a fundamental understanding of the implications and limitations of EVA metrics, which are outlined below:
■ Potential added strategic clarity—For many companies, EVA could play a valuable role in helping management teams and compensation committees understand if their incentive plans should emphasize growth or profitability-oriented performance measures:
― Consistent returns > cost of capital = more emphasis on growth
― Consistent returns < cost of capital = more emphasis on returns, margins, efficiency
■ Useful metrics need not be incentive metrics—EVA can be a powerful and valuable metric. However, historically it has been plagued by lack of understanding, worsened further by over-engineering. The information gained from EVA can often be simplified into other, more familiar metrics that are better understood by a wider audience. The underlying goals and emphasis of these more conventional metrics can be tailored and informed by the more sophisticated EVA analysis.
■ Value of going beyond GAAP—EVA may be most interesting in those instances where a company’s FPA score under the traditional GAAP-based metrics is different from its EVA score. In particular, if the GAAP-based results are positive but the EVA results are not, companies may wish to understand why.
■ Low results and potential variability—EVA is a profitability metric with an additional charge—the charge for the cost of capital. The added cost means ordinary profitability will be lower. With low numbers often comes high volatility, particularly in trend/growth rate metrics since percent changes can be magnified when starting from small(er) numbers.
■ Timing, timing, timing—One of the merits of EVA is that it embeds in a single measure the two long-term drivers of value—profitability (returns above cost of capital) and growth (additional high return investments). However, there is often a time lag between when value-added growth investments hit the balance sheet and when higher EVA results. In some cases, these lags can be considerable.
Similarly, for natural resource-related industries there can be both substantial price volatility and prolonged industry cycles that give rise to “boom and bust” periods. Consequently, like any financial metric, EVA is prone to distortions and incomplete understanding without a wider strategic context. It should not be used in isolation or without the context of time.
■ EVA is less applicable to some industries—There are industries where EVA simply does not work as well:
― Financial services: Most financial services companies have an intimate understanding of their economic profits, measured as earnings spreads against their own definitions of economic capital.
― Business services: Low capital intensity industries, those with modest to nil capital expenditures, gain little if any incremental information from EVA than they would from ordinary profitability and/or margin measures.

Appendix: Adjustments to Financial Data Incorporated by EVA
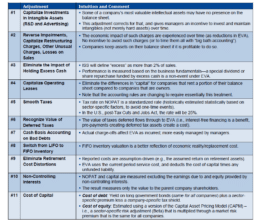
ISS’s primer on EVA notes that the calculation of EVA in some instances can require significant adjustments to GAAP measures. The below table provides a non-exhaustive list of these adjustments. The merits of these adjustments to GAAP need to be weighed based on their economic sense, actual and perceived governance rationale and overall complexity.
ISS has indicated that any adjustment to income measures needs to have a corresponding adjustment to a balance sheet measure. For instance, removing R&D expenses means such expenses should be capitalized and included in a company’s capital base. Over time, such dual adjustments will give rise to the possibility that book capital and “economic capital” will vary from each other (potentially in perpetuity).

1 Simplified definition: WACC = [(Debt Capital/Total Capital) × (After-Tax Cost of Debt) + (Equity Capital/Total Capital) × (Cost of Equity)]
* * * * *
The Client Update is prepared by Meridian Compensation Partners’ Regulatory and Governance Practice led by Donald Kalfen. Questions regarding this Client Update or executive compensation technical issues may be directed to Donald Kalfen at 847-235-3605 or dkalfen@meridiancp.com.
This report is a publication of Meridian Compensation Partners, LLC, provides general information for reference purposes only, and should not be construed as legal or accounting advice or a legal or accounting opinion on any specific fact or circumstances. The information provided herein should be reviewed with appropriate advisors concerning your own situation and issues.
www.meridiancp.com
