 Alysse Merila
 Tina Murphy
Meridian’s 2024 Retail Incentive Trends Report summarizes the current retail environment and trends, highlighting the direction companies are taking regarding incentive design. Overall, results are consistent with the prior year’s study, indicating that most retailers continue to operate in a steady state.
This study represents 108 retail and restaurant companies within the Consumer Discretionary and Consumer Staples GICS industry sectors.
Highlights
Annual Incentive Plan Design Practices
• Almost 50% of companies used two financial metrics, while another 37% used just one.
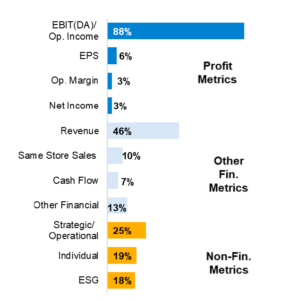
• As shown to the right, all companies used at least one profit metric (e.g., EBIT(DA), operating income, operating margin, EPS, or net income), often paired with a revenue/sales metric and 52% of companies also included at least one non-financial metric.
• The most prevalent payout range was 50% at threshold and 200% at maximum.
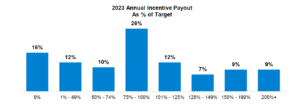
Note: Shown below, there was a wide range of payouts for 2023 annual incentive plans, with the biggest cluster at 75%-100% (26% prevalence). 64% of companies paid out below target, leading to an average payout of 89% of target.


Long-Term Incentive Plan Design and Vehicle Mix Practices
Almost 1/4th of companies made changes to the LTI mix in 2023 or 2024 (if disclosed). The most prevalent change was to increase PSU weighting, typically in conjunction with a decrease to RSU or stock option weighting.
• 84% of respondents used a performance-based vehicle, while 79% used RSUs and 30% used stock options.
• The average mix of LTI awards for CEOs was 52% PSUs, 35% RSUs, and 13% stock options, with just a slightly lower weighting on PSUs and correspondingly higher weighting on RSUs for Other NEOs.
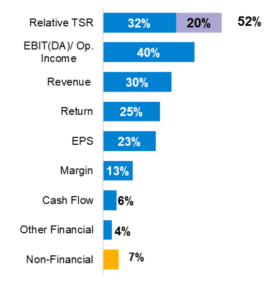
• As shown in the exhibit below, Relative Total Shareholder Return (rTSR) was the most prevalent metric used in performance-based plans (52%), followed by EBIT(DA)/operating income (40%) and revenue (30%).
― Of those that used rTSR, 63% used it as a standalone metric and 37% used it as a modifier.
― 65% of companies that used rTSR used either an Index or an Index Subset (e.g., S&P Retail Select Index) for the comparator group with the remaining 35% using the compensation peer group or a custom performance group.
― While we had previously seen a shift to requiring above median rTSR performance for target payout, this year showed that only 30% of companies required above median performance (e.g., 55th percentile).
― 39% of companies included a payout cap for negative absolute performance (i.e., if absolute TSR over the performance period is negative, payouts are capped at target).

The financial highlights of the 108 companies represented in this study are shown below. All figures shown are as of September 15, 2024.


