The primary purpose of an annual incentive plan, also called an annual bonus plan, is to drive and reward behaviors that have an impact on the operating success of the company. Following is information on how such plans are typically designed, including participation, payout opportunities, performance metrics and payout curve.
Participation
Payout Opportunities
Bonus opportunities are generally expressed as a percent of base salary and payout opportunities are set at three levels: Target, Maximum and Threshold.
| Level of Bonus Opportunity | Explanation | Market Practice |
| Maximum |
|
Typically set at 200% of target
Companies with more predictable earnings may choose to have less leverage in their payout structures, e.g., having a 150% maximum |
| Target |
|
Target bonuses may range from about 10% of salary at the lowest levels up to 150% of salary or more for the CEO |
| Threshold |
|
The most common payout level for threshold performance is 50% of target, although some companies will begin payouts at $1 as soon as threshold goals are exceeded
|
Performance Metrics
Generally companies select two to four performance metrics to use in their annual incentive plan. Metrics are generally financial, though quantifiable business objectives can also be used. Companies may use corporate or business unit financial metrics to fund an overall incentive pool, and then use individual performance as a modifier to determine final individual payouts. Or, companies may use a scorecard where each metric (corporate, business unit or individual) has a specific weighting. Individual performance is generally less of a factor for the more senior executives.
Performance measures are usually absolute goals. Using relative performance versus a peer group is uncommon for three primary reasons:
- Annual bonuses play a unique role in focusing participants on achieving the best performance possible in the prevailing economic environment.
- The necessary financial information may not be available to pay bonuses in a timely manner.
- Relative performance may be more valid when compared over a multi-year period.
Many companies will seek to balance a growth measure (Operating Income, EPS) with a return measure (ROE, ROIC), and a top-line measure (revenue growth, market share) with a bottom-line measure (net income growth, cash flow).
Most companies use a formulaic approach to their annual bonus plan, but some allow for discretion in determining payout levels.
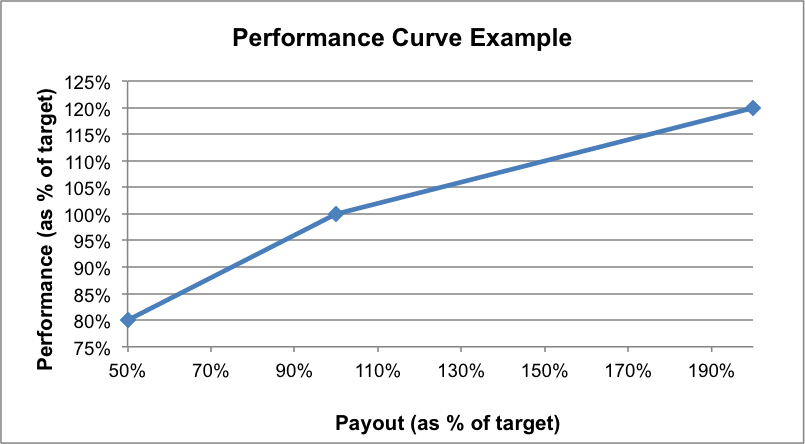
Payout Curve
An annual incentive plan must establish a relationship between target, threshold and maximum performance versus payout. While highly dependent upon each individual company’s situation and the metrics used, a common threshold performance level would be 80%–90% of target performance and a common maximum performance level would be 110%–120% of target performance.
The graphic below provides an example. Curves may vary among and even within industries and will depend on how easy it is to set performance goals. For example, in cases when goal setting is particularly difficult due to economic uncertainties or other issues, a Committee may choose to create a relatively flatter slope, with less variability in payout for any given change in performance.