 Andrew McElheran
More and more public companies are adopting performance share unit (PSU) plans as a significant component of long-term (equity) compensation for executives.[1]
The most common PSU performance metric is total shareholder return (TSR – i.e., stock price growth plus dividends) compared to performance peer companies. The choice of performance peers has a significant impact on a company’s performance under the plan. This update discusses key considerations for selecting an appropriate peer group for relative performance assessment.
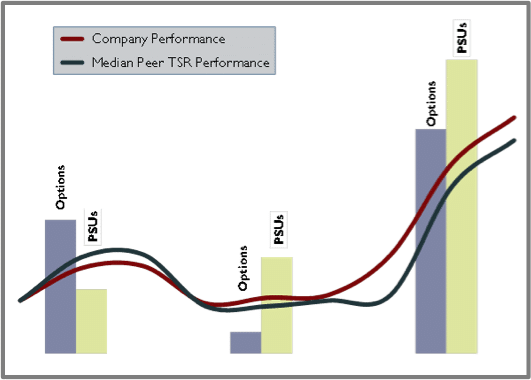
The graphic below provides a simple illustration of the difference in realized award values from relative TSR-linked PSUs, in contrast with stock options, in differing capital market conditions.

Rising capital markets may lead to significant gains from stock option awards despite under- performance in relative terms. (This is one of the reasons why stock options are not viewed as performance-based compensation by some third parties.)
In contrast, PSUs will deliver value for relative outperformance, even in difficult markets – so long as the peer companies are well selected and subject to more or less the same external factors.
Why Relative Performance? Why TSR?
Relative standards for performance are often used in PSU plans because these are much easier to track than setting challenging multi-year goals. PSU performance is usually measured over a three-year period, but setting three-year absolute goals (e.g., “X”% growth in earnings) is difficult for both management teams and compensation committees. Defining performance in terms of relative ranking against peers is easier – all a committee has to do is express a philosophical preference about what portion of peers a company has to outperform in order to earn a PSU payout at some level. The market does all of the heavy lifting, taking into account the macroeconomic and other market factors affecting the business.
Some companies measure relative performance against a financial measure (like earnings growth, or return on capital), but TSR is the most common relative performance metric because capital market data is highly visible and standardized, making “apples to apples” comparisons much easier across peer companies. Having said that, relative TSR has been criticized as being an “outcome” measure that is too far removed from the “line of sight” performance objectives that executives can directly influence.
Choices for Performance Peers
In Canada, given the smaller market, many companies are challenged to find a group of companies that meets the criteria both for a good performance measurement group and a good compensation benchmarking group.
The most important selection criteria for compensation benchmarking peers are: 1) within a reasonable size range of the subject company; 2) ideally from the same or a similar business.
For performance peers, these priorities get reversed. Peer company size is less important, while business similarity and risk profile are much more important.
For many companies, the two groups will overlap to a degree.

In 2015, more than 60% of S&P/TSX 60 companies disclosed that they used at least one relative performance measure. Of those:
- 34% use the same peer group that the company uses for executive compensation benchmarking
- 50% use a custom peer group specifically for assessing relative performance
- 34% use the companies in an index
- 5% use multiple indices
Analytical Approaches to Help Find Enough Good Peers
While there is no hard-and-fast rule for how many peers should be in a performance peer group, relative performance measures are more volatile for a group with less than 15-20 companies (for example, with a 20-company group, moving past one company in the rankings is equal to a 5 percentile shift).
But many companies do not have 20 natural performance peers. A three step analysis can help to build the group further:
1. Start with a Robust Universe of Potential Peers
The obvious starting point is to consider companies in the same or similar industry sectors. In particular, there may be obvious peers that have been excluded from a compensation benchmarking peer group because they are too large or too small. Size is of secondary importance for performance peers. Building a large initial universe – dozens or even hundreds of potential candidates, from industry codes – is a natural starting point.
2. Correlation Analysis, Risk Analysis
Not all companies from this universe will be equal. The best peers will have historical stock price performance that is reasonably well-correlated with the subject company’s performance. We recommend that correlations be assessed over 3 to 5 years.
An analysis of risk sensitivity can also add insight. A simple single-factor model such as a stock’s Beta can help to compare companies. Potential peers with Betas that are materially different from the company’s own are likely to react differently to changes in broad market conditions.
Correlation and risk sensitivity analysis can be especially useful if the initial universe of peer companies covers a wide range of industry sectors because there are few natural performance peers.
3. Back-Testing
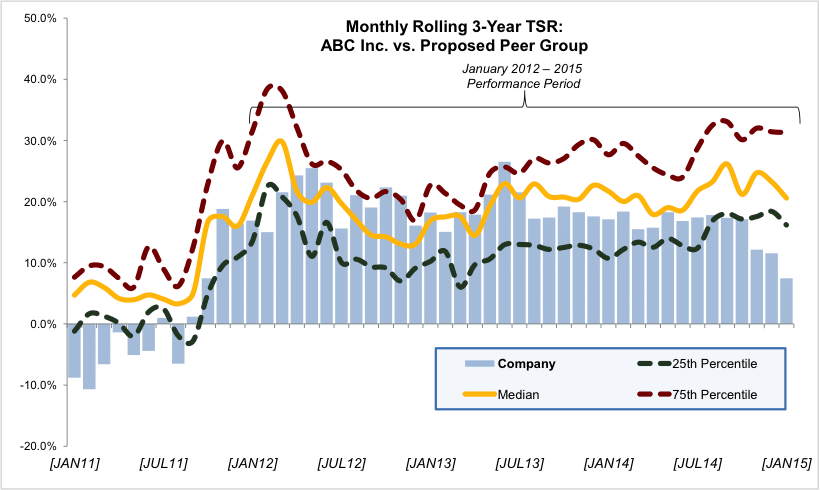
Any potential performance peer group should be back tested to understand if any companies are consistently outliers over time. Obviously past performance is no predictor of future results, but a group with few outliers and a consistently tight distribution of outcome is likely to generate results that are fairer to participants than one with wide-ranging outcomes and outlier companies. A graphical depiction of this kind of back-testing is shown below:

Using an Index Versus a Custom Group
For some companies it makes sense to use the companies of an established index instead of a purpose-specific performance peer group. Reasons for using an index are:
- Not enough natural performance peers. If you can’t build a suitable custom peer group – particularly one with enough companies – the companies in an index can provide a reasonable fallback option. Indices will generally have a substantially larger number of companies than most custom-built groups.
- To preserve an arms-length relationship. For some committees, there is value in being able to say that the index companies are determined and maintained by the index provider. In other words, there is no perceived bias in the selection of performance peers based on an index.
- To create diversification. A modest trend we have seen at some companies has been to use a custom group and an index in tandem, each for a portion of the relative TSR award. This typically happens if there are few business competitors, so the custom group has a small number of companies making performance relative to that group volatile. The index includes a larger number of companies, often chosen on the basis that they are competitors for shareholder investment, rather than business. The use of the index companies, in addition to the custom group companies, tends to balance the more volatile custom group-based results.
- For bellwether companies, as a proxy for investors’ results when investing in “the market”. For larger companies (e.g., S&P/TSX 60 firms), the company and the broad market index may be investment alternatives.
For companies that elect to use a broad market index as their relative performance standard (e.g., the S&P/TSX 60 or the full S&P/TSX Composite), we still recommend using percentile positioning, rather than a percentage above or below the index, because determining the +/- percentage has many of the same target setting challenges as using an absolute metric.
For larger companies, PSUs typically comprise at least 50% of the long term incentive. Most PSU plans use relative performance standards. Consequently, choosing the right performance peer group is often the most crucial element of what will often be the largest portion of an executive’s compensation. The right group should be determined based on a combination of industry/competitor considerations and rigorous analytical review.
* * * * *
The Client Update is prepared by Meridian Compensation Partners. Questions regarding this Client Update or executive compensation technical issues may be directed to:
Christina Medland at (416) 646-0195, or cmedland@meridiancp.com
Andrew McElheran at (416) 646-5307, or amcelheran@meridiancp.com
Andrew Stancel at (647) 478-3052, or astancel@meridiancp.com
Andrew Conradi at (416) 646-5308, or aconradi@meridiancp.com
John Anderson at (847) 235-3601, or janderson@meridiancp.com
This report is a publication of Meridian Compensation Partners Inc. It provides general information for reference purposes only and should not be construed as legal or accounting advice or a legal or accounting opinion on any specific fact or circumstances. The information provided herein should be reviewed with appropriate advisors concerning your own situation and issues.
[1] For background on prevalence at the S&P/TSX 60, see Meridian’s October 2015 update, “Trends in Executive Compensation at the TSX 60”.
